What is PageSpeed Insights?
PageSpeed Insights generates a report on the user experience of a website on both mobile and desktop and provides suggestions to make improvements. If you’ve never heard of the tool, “Google Lighthouse,” it’s a long, automated checklist for your website. After the test, Lighthouse assigns a score for your website to four categories:
- Performance
- Accessibility
- Best Practices
- SEO
In short, PageSpeed Insights is simply one way to run a Lighthouse test on your website that shows a combination of both real user data and the test results. In this post, we’ll cover various ways to improve your PageSpeed Insights score.
Example PageSpeed Insights Report: YouTube
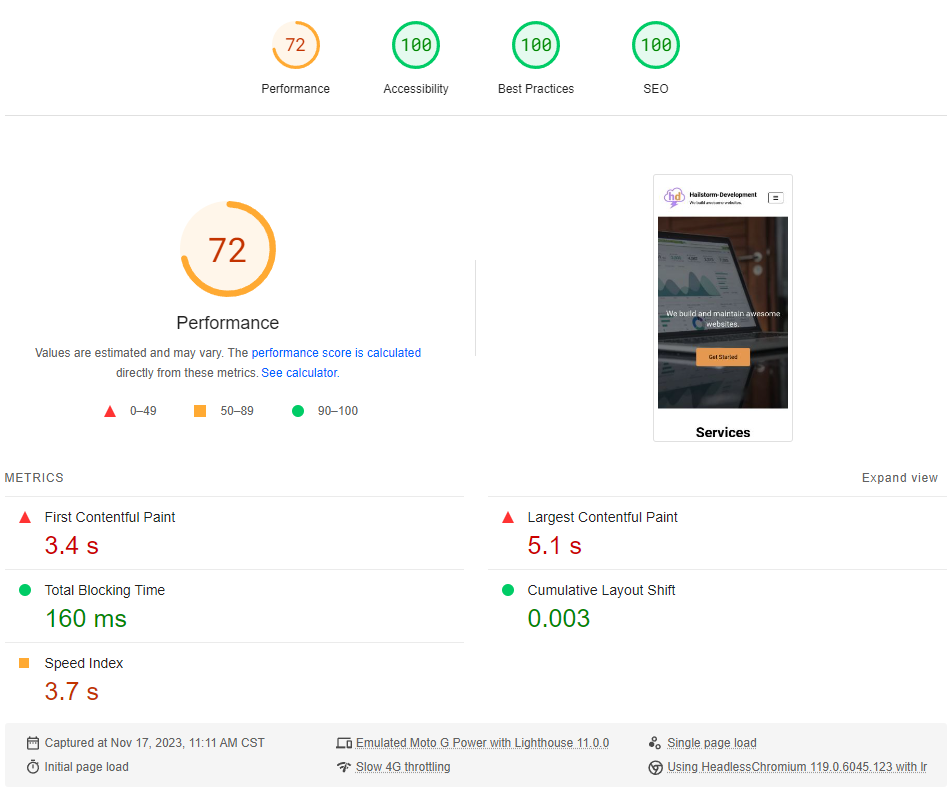
Example Report: Hailstorm-Development
Above, you can see another example of the PageSpeed Insights report for hailstorm-development.com. In this one, you’ll notice the performance score is lower, but the accessibility score is 96 compared to 89 for desktop browsers. Generally, desktop scores are higher than mobile because of load times.
How to Test Your Website with Lighthouse
- Enter your URL to start the test
- Review PageSpeed Insights report and test results
- Implement suggested changes, aim for green scores
How to Read Your Report
| Metric | Score Contribution | What It Does |
|---|---|---|
| Total Blocking Time | 30% | Measures the amount of time that a page is blocked from reacting to user input, like a mouse click |
| Largest Contentful Paint | 25% | Calculates the time a page takes to load its largest element for users |
| Cumulative Layout Shift | 25% | Measures the layout shifts that occur as users access a page |
| First Contentful Paint | 10% | Measures the time at which first text or image becomes visible to users |
| Speed Index | 10% | Shows how quickly the content of a page is loaded |
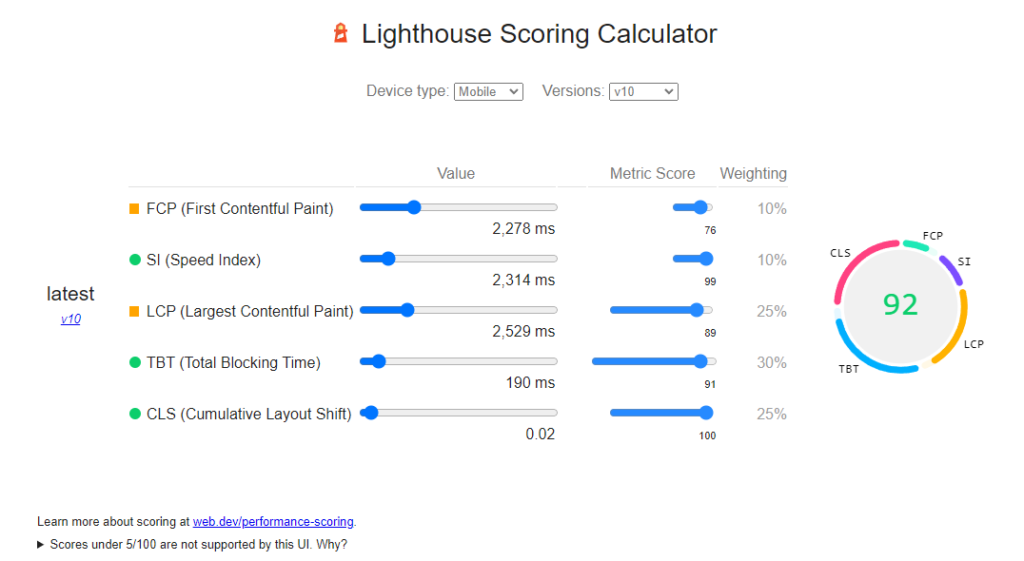
Next, you must know what each score measures and how it affects your website’s overall scoring. This should help you to prioritize which features to try to improve first. If you want to see a more detailed breakdown of your score, simply click on “See Calculator” and it will show you a detailed calculation like this:
How to View Lighthouse Recommendations
Once your report has finished generating, all you have to do is scroll down and click on the various metrics to load suggestions and estimated savings.
In this screenshot, you can see that the first opportunity is to eliminate render-blocking resources. There is a link as well that includes a how-to document regarding these changes. Lastly, you can see the transfer size and estimated potential savings in the third column.
Going through each of these suggestions could highlight how many small adjustments can be made for a score boost.
In Conclusion
Ultimately, it may be difficult to increase your score in Google Lighthouse, but investing in it will pay off in many ways. Not only will you be able to determine what changes need to be made to improve accessibility, but also identify other areas to improve like reducing unused CSS and JavaScript. What do you think about PageSpeed Insights? Let us know in the comments below.
Resources & Further Reading
DebugBear. (2023, October 8). How to test your website speed with Google Lighthouse. Search Engine Journal. https://www.searchenginejournal.com/website-speed-google-lighthouse-debugbear-spa/496707/
Gibbons, J. (n.d.). Google pagespeed insights vs. lighthouse. Quattr. https://www.quattr.com/core-web-vitals/page-speed-insights-vs-lighthouse
Google. (n.d.). About pagespeed insights | google for developers. Google. https://developers.google.com/speed/docs/insights/v5/about
Recent Posts
The Success Series: How to Leverage Storytelling in Interviews
Learn how to categorize your work and personal experience so...
Read MoreGreat Tech Deals for Amazon Prime Day 2024
Great Tech Deals – Amazon Prime Day 2024 This post...
Read MoreQuick Guide to Google Search
What’s New in Google Search? If you own a business,...
Read MoreMicrosoft Edge’s New RAM Slider
What the RAM Slider Will Do Twitter (now X) user...
Read More


